1. Introduction
1.1 OVERVIEW:
As accelerating personal computing power threatens the position of mainframe computer systems, the trend in the IT industry seems to be moving towards distributed processing solutions. However, in the past few years, this trend appears to be reversing. Companies of all sizes are rationalising IT support costs and seek to maximise return on investment in its computer infrastructure. As networking for internal and external use become more complex, computers, servers, routers and hubs are increasingly being installed in central computer room or server farms. There are two reasons for this trend.
Firstly, servers have become more task specific, for examples, email servers, database servers, Internet servers, etc. It makes more sense to locate them in one room where they can be more easily managed. Secondly, it is easier to install and manage external communications such as Internet, email and Lotus Notes from a central location.
In the case of an abnormal condition in an electrical distribution system, people generally think of a power interruption. But today, power systems are cluttered with other interruptions, including harmonics, transients and electrical noise. Also, power from a utility might undergo significant voltage sags or swells, frequency variations, undervoltages,overvoltages and spikes.So a UPS not only provides power to critical equipment under during an outage; it also protects them from damage attributed to power quality problems.
Since UPS units play an important role in maintaining a highly reliable power source for facility operations, it is important for managers to specify devices that can monitor the performance and condition of UPS systems.In recent years, manufacturers have developed advanced technology to assist mangers in monitoring UPS. These devices continually monitor a UPS and provide valuable information on the system’s status, including remaining back-up time, battery test schedule, shutdown software, and broadcast and paging capabilities for predetermined events.
During a power interruption, a UPS can service the critical load as long as its battery bank has an adequate electric charge. To enable a UPS to continue serving the load, managers need to provide an emergency generator to charge this battery bank.
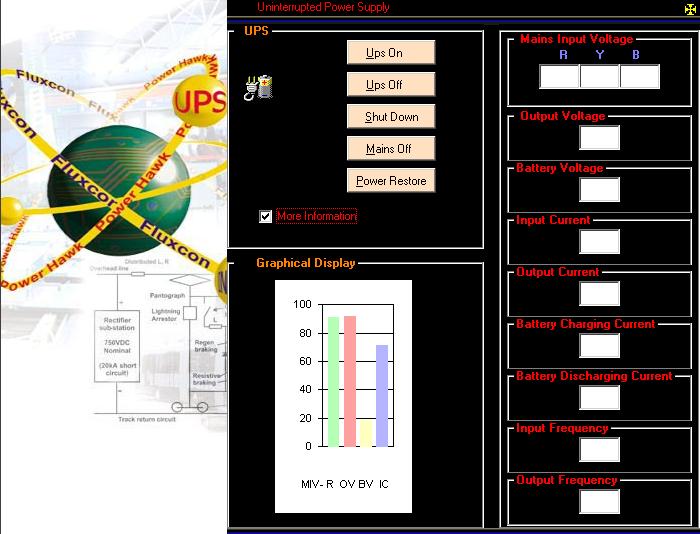
UPS monitoring is the information collection function of management of UPS monitoring.UPS monitoring applications are created to collect data for UPS management applications. Monitoring a UPS provide valuable information on the system’s status, remaining back-up time, battery test schedule,shutdown software. In the case of network , the systems in that may be connected to a UPS which can provide the functions to these systems.In this case the manager of UPS monitoring can send the UPS information to all these systems.By this the Manager can remotely shutdown the systems as they wanted .
1.1.1 PURPOSE OF THE PROJECT:
The purpose of this project is to develop the need to secure Uninterruptible Power System (UPS) to protect the networks from power problems. It has been estimated that as much as 45 per cent of data loss in unprotected data systems is caused by poor quality power. Even one unprotected computer or data communications device can paralyse the whole network and cause it to crash. To businesses running mission critical applications, such disruption is unacceptable.
Where computer equipment are located in close proximity, a centralised UPS can offer several advantages. It protects all the IT equipment in the server farm, servers, hubs, routers etc. Importantly, it facilitates the IT manager to configure the power protection system and add new equipment to the load subsequently. There is no need to purchase new UPS with every new purchase of IT equipment. Moreover, it is easy to upgrade, service and manage a single battery and the price per KVA protection is very economical. Also, instead of having several individual UPS to keep track of , there is just one large UPS capable of protecting the server farm.
1.1.2 Factors to Consider:
There are some crucial factors to consider when choosing a centralised UPS.
Battery time
UPS should have adequate battery backup time to protect the whole server farm in the event of a power blackout. Typically, the back up time selected is between 10 and 30 minutes. However, back up times up to several hours are not uncommon. UPS should also feature scaleable back up time. This is especially so if the UPS is already installed and a longer period of autonomy is needed. Another consideration is size. UPS should have a small footprint so that it can fit easily into server and computer rooms where space is at a premium. It should also be easy to install, using 3-phase wiring systems.
Communications
UPS should have good monitoring and communications facilities, including facility for a direct network connection. This can either be local monitoring via power monitoring/shutdown software or through remote links to the UPS vendor.
Battery Monitoring and Life
Battery is the heart of UPS and key to UPS reliability. The UPS should therefore be able automatically check its battery condition at regular intervals. This is to ensure that the battery is capable of supporting the load in the event of a power problem. UPS with intermittent charging feature is preferable as it extends the usable battery life by an average of 50%.
Shutdown Software
In the event of a power failure, the UPS software should be able shut down the network in an orderly fashion. The best shutdown software provide sequential network shutdown. This means that workstations, communication devices and file servers are shutdown in the correct order instead of the traditional server-only shutdown. It also means that the IT manager can prioritise the parts of the network that are most critical and therefore to be shutdown last. Likewise, non-critical equipment can be shutdown first.
Predictive Software
For most critical UPS installations, detailed UPS monitoring can be used to prevent down time. This advanced software allows detailed UPS monitoring and performance analysis. This enables the user to build up a detailed picture of the performance of the UPS equipment, spot any potential problems and predict future scenarios so that preventive action can be taken (when appropriate). Provided these factors are taken into account, companies will find that the centralised UPS solution can provide cost-effective power protection. Also, it is not just the IT sector which can benefit from a centralised UPS installation. In industrial use, UPS unit is often located away from the process monitors in the control room. Having centralised control of the UPS can alert the control room manager of potential power problems that may lead to disrupted production and financial loss.
1.2 OBJECTIVES OF THE PROJECT:
- Reduce system and network downtime for maximum productivity.
- Scalability to keep up with emerging technologies and bandwidth-hungry applications.
- Flexibility to configure the UPS to complement the organization’s need.
- Compatibility with existing multi vendor system components and future standards-based devices.
- Automatic saving of files to a particular location during shutdown.Providing remote machine configuration and information about the running programs.
1.3. INTRODUCTION TO SERIAL COMMUNICATION:
All IBM PC and compatible computers are typically equipped with two serial ports and one parallel port. Although these two types of ports are used for communicating with external devices, they work in different ways.
A parallel port sends and receives data eight bits at a time over 8 separate wires. This allows data to be transferred very quickly; however, the cable required is more bulky because of the number of individual wires it must contain. Parallel ports are typically used to connect a PC to a printer and are rarely used for much else. A serial port sends and receives data one bit at a time over one wire. While it takes eight times as long to transfer each byte of data this way, only a few wires are required. In fact, two-way (full duplex) communications is possible with only three separate wires - one to send, one to receive, and a common signal ground wire.
Bi-Directional Communications
The serial port on your PC is a full-duplex device meaning that it can send and receive data at the same time. In order to be able to do this, it uses separate lines for transmitting and receiving data. Some types of serial devices support only one-way communications and therefore use only two wires in the cable - the transmit line and the signal ground.
Communicating by Bits
Once the start bit has been sent, the transmitter sends the actual data bits. There may either be 5, 6, 7, or 8 data bits, depending on the number you have selected. Both receiver and the transmitter must agree on the number of data bits, as well as the baud rate. Almost all devices transmit data using either 7 or 8 databits.
Notice that when only 7 data bits are employed, you cannot send ASCII values greater than 127. Likewise, using 5 bits limits the highest possible value to 31. After the data has been transmitted, a stop bit is sent. A stop bit has a value of 1 - or a mark state - and it can be detected correctly even if the previous data bit also had a value of 1. This is accomplished by the stop bit's duration. Stop bits can be 1, 1.5, or 2 bit periods in length.
The Parity Bit
Besides the synchronization provided by the use of start and stop bits, an additional bit called a parity bit may optionally be transmitted along with the data. A parity bit affords a small amount of error checking, to help detect data corruption that might occur during transmission. You can choose either even parity, odd parity, mark parity, space parity or none at all. When even or odd parity is being used, the number of marks (logical 1 bits) in each data byte are counted, and a single bit is transmitted following the data bits to indicate whether the number of 1 bits just sent is even or odd.
For example, when even parity is chosen, the parity bit is transmitted with a value of 0 if the number of preceding marks is an even number. For the binary value of 0110 0011 the parity bit would be 0. If even parity were in effect and the binary number 1101 0110 were sent, then the parity bit would be 1. Odd parity is just the opposite, and the parity bit is 0 when the number of mark bits in the preceding word is an odd number. Parity error checking is very rudimentary. While it will tell you if there is a single bit error in the character, it doesn't show which bit was received in error. Also, if an even number of bits are in error then the parity bit would not reflect any error at all.
Mark parity means that the parity bit is always set to the mark signal condition and likewise space parity always sends the parity bit in the space signal condition. Since these two parity options serve no useful purpose whatsoever, they are almost never used.
RS-232C
RS-232 stands for Recommend Standard number 232 and C is the latest revision of the standard. The serial ports on most computers use a subset of the RS-232C standard. The full RS-232C standard specifies a 25-pin "D" connector of which 22 pins are used. Most of these pins are not needed for normal PC communications, and indeed, most new PCs are equipped with male D type connectors having only 9 pins.
DCE and DTE Devices
Two terms you should be familiar with are DTE and DCE. DTE stands for Data Terminal Equipment, and DCE stands for Data Communications Equipment. These terms are used to indicate the pin-out for the connectors on a device and the direction of the signals on the pins. Your computer is a DTE device, while most other devices are usually DCE devices.
If you have trouble keeping the two straight then replace the term "DTE device" with "your PC" and the term "DCE device" with "remote device" in the following discussion.
The RS-232 standard states that DTE devices use a 25-pin male connector, and DCE devices use a 25-pin female connector. You can therefore connect a DTE device to a DCE using a straight pin-for-pin connection. However, to connect two like devices, you must instead use a null modem cable. Null modem cables cross the transmit and receive lines in the cable, and are discussed later in this chapter. The listing below shows the connections and signal directions for both 25 and 9-pin connectors.
The TD (transmit data) wire is the one through which data from a DTE device is transmitted to a DCE device. This name can be deceiving, because this wire is used by a DCE device to receive its data. The TD line is kept in a mark condition by the DTE device when it is idle. The RD (receive data) wire is the one on which data is received by a DTE device, and the DCE device keeps this line in a mark condition when idle.
RTS stands for Request To Send. This line and the CTS line are used when "hardware flow control" is enabled in both the DTE and DCE devices. The DTE device puts this line in a mark condition to tell the remote device that it is ready and able to receive data. If the DTE device is not able to receive data (typically because its receive buffer is almost full), it will put this line in the space condition as a signal to the DCE to stop sending data. When the DTE device is ready to receive more data (i.e. after data has been removed from its receive buffer), it will place this line back in the mark condition. The complement of the RTS wire is CTS, which stands for Clear To Send.
25 Pin Connector on a DTE device (PC connection)-Male RS232 DB25 |
Pin Number |
Direction of signal: |
1 |
Protective Ground |
2 |
Transmitted Data (TD) Outgoing Data (from a DTE to a DCE) |
3 |
Received Data (RD) Incoming Data (from a DCE to a DTE) |
4 |
Request To Send (RTS) Outgoing flow control signal controlled by DTE |
5 |
Clear To Send (CTS) Incoming flow control signal controlled by DCE |
6 |
Data Set Ready (DSR) Incoming handshaking signal controlled by DCE |
7 |
Signal Ground Common reference voltage |
8 |
Carrier Detect (CD) Incoming signal from a modem |
20 |
Data Terminal Ready (DTR) Outgoing handshaking signal controlled by DTE |
22 |
Ring Indicator (RI) Incoming signal from a modem |
The DCE device puts this line in a mark condition to tell the DTE device that it is ready to receive the data. Likewise, if the DCE device is unable to receive data, it will place this line in the space condition. Together, these two lines make up what is called RTS/CTS or "hardware" flow control. The Software Wedge supports this type of flow control, as well as Xon/XOff or "software" flow control. Software flow control uses special control characters transmitted from one device to another to tell the other device to stop or start sending data. With software flow control the RTS and CTS lines are not used.
9 Pin Connector on a DTE device (PC connection)-Male RS232 DB9 |
Pin Number |
Direction of signal: |
1 |
Carrier Detect (CD) (from DCE) Incoming signal from a modem |
2 |
Received Data (RD) Incoming Data from a DCE |
3 |
Transmitted Data (TD) Outgoing Data to a DCE |
4 |
Data Terminal Ready (DTR) Outgoing handshaking signal |
5 |
Signal Ground Common reference voltage |
6 |
Data Set Ready (DSR) Incoming handshaking signal |
7 |
Request To Send (RTS) Outgoing flow control signal |
8 |
Clear To Send (CTS) Incoming flow control signal |
9 |
Ring Indicator (RI) (from DCE) Incoming signal from a modem |
DTR stands for Data Terminal Ready. Its intended function is very similar to the RTS line. DSR (Data Set Ready) is the companion to DTR in the same way that CTS is to RTS. Some serial devices use DTR and DSR as signals to simply confirm that a device is connected and is turned on. The Software Wedge sets DTR to the mark state when the serial port is opened and leaves it in that state until the port is closed. The DTR and DSR lines were originally designed to provide an alternate method of hardware handshaking. It would be pointless to use both RTS/CTS and DTR/DSR for flow control signals at the same time. Because of this, DTR and DSR are rarely used for flow control.
CD stands for Carrier Detect. Carrier Detect is used by a modem to signal that it has a made a connection with another modem, or has detected a carrier tone.
The last remaining line is RI or Ring Indicator. A modem toggles the state of this line when an incoming call rings your phone.
The Carrier Detect (CD) and the Ring Indicator (RI) lines are only available in connections to a modem. Because most modems transmit status information to a PC when either a carrier signal is detected (i.e. when a connection is made to another modem) or when the line is ringing, these two lines are rarely used.
9 to 25 Pin Adapters
The following table shows the connections inside a standard 9 pin to 25 pin adapter.
9-Pin Connector |
25 Pin Connector |
Pin 1 DCD |
Pin 8 DCD |
Pin 2 RD |
Pin 3 RD |
Pin 3 TD |
Pin 2 TD |
Pin 4 DTR |
Pin 20 DTR |
Pin 5 GND |
Pin 7 GND |
Pin 6 DSR |
Pin 6 DSR |
Pin 7 RTS |
Pin 4 RTS |
Pin 8 CTS |
Pin 5 CTS |
Pin 9 RI |
Pin 22 RI |
Baud vs. Bits per Second
The baud unit is named after Jean Maurice Emile Baudot, who was an officer in the French Telegraph Service. He is credited with devising the first uniform-length 5-bit code for characters of the alphabet in the late 19th century. What baud really refers to is modulation rate or the number of times per second that a line changes state. This is not always the same as bits per second (BPS). If you connect two serial devices together using direct cables then baud and BPS are in fact the same. Thus, if you are running at 19200 BPS, then the line is also changing states 19200 times per second. But when considering modems, this isn't the case.
Because modems transfer signals over a telephone line, the baud rate is actually limited to a maximum of 2400 baud. This is a physical restriction of the lines provided by the phone company. The increased data throughput achieved with 9600 or higher baud modems is accomplished by using sophisticated phase modulation, and data compression techniques.
Synchronous and Asynchronous Communications
There are two basic types of serial communications, synchronous and asynchronous. With synchronous communications, the two devices initially synchronize themselves to each other, and then continually send characters to stay in sync. Even when data is not really being sent, a constant flow of bits allows each device to know where the other is at any given time. That is, each character that is sent is either actual data or an idle character. Synchronous communications allows faster data transfer rates than asynchronous methods, because additional bits to mark the beginning and end of each data byte are not required. The serial ports on IBM-style PCs are asynchronous devices and therefore only support asynchronous serial communications.
The beginning and end of each byte of data must be identified by start and stop bits. The start bit indicates when the data byte is about to begin and the stop bit signals when it ends. The requirement to send these additional two bits causes asynchronous communication to be slightly slower than synchronous however it has the advantage that the processor does not have to deal with the additional idle characters.
An asynchronous line that is idle is identified with a value of 1 (also called a mark state). By using this value to indicate that no data is currently being sent, the devices are able to distinguish between an idle state and a disconnected line. When a character is about to be transmitted, a start bit is sent. A start bit has a value of 0 (also called a space state). Thus, when the line switches from a value of 1 to a value of 0, the receiver is alerted that a data character is about to be sent.
2.SYSTEM ANALYSIS
System analysis is a detailed study of the various operations performed by a system and their relationship within and outside the system. The emphasis in system analysis is on identifying what is needed from the system, and not how the system will achieve its goal.
There are two major activities in this phase
- Analysis
- Requirement Specification
The analyst has to understand the problem and its context. The System Requirement Specification (SRS) document must specify all functional and performance requirements, the format of inputs, outputs and any required standards, and all design constraints that exist should be defined.
2.1 STUDY ON EXISTING SYSTEM:
The goal of this phase is to understand the requirements of the new system that is to be developed. Analysis involves getting data from the people who are currently working in the existing system. This data and the existing documents about the current mode of operation are the basic source of information for the analysts. The process of obtaining answers to questions that might arise in an analyst’s mind continues until the analyst feels assured that all the information has been obtained. Corporations of all sizes rely on system reliability and information delivery. Network or system downtime or degradation can cost companies from $5000 to $10000 per hour in diminished productivity and cost revenue. These tools also require external support, which causes a great deal of concern to the administrator while installing these packages as constant new technologies keep offering new complexities.
2.2 STUDY ON PROPOSED SYSTEM:
The UPS Monitoring System is a tool, which is used to monitor the UPS. It helps the administrator to keep pace with the evolving demands. It is no longer sufficient for the administrator to be satisfied with just controlling a particular system, he has to be aware of what use the various computers in the network are being put to. This software can be used in any sort of environment from an office to a students’ lab.In network ,if battery voltage is low the administrator can send siganalling information to the network systems,such as shutdown signal and can perform remote shutdown. Normally during shutdown process due to power failiure there is no chance for saving the files on the user working,but in this case there is another fascility that during these case files can be automatically saved to a predetermined location.
2.3 FEASIBILITY STUDY:
Feasibility study is a test of system proposal according to its workability, impact on the organization, ability to meet the user needs and effective use of resources. It focuses on three major questions:
- What are the users needs and how does a candidate system meet them?
- What resources are available for given candidate system?
- Is the problem worth solving?
- What are the likely impacts of the candidate system on the organization?
The objective of a feasibility study is not to solve the problem but to acquire a sense of its scope. The goal of feasibility studies is to evaluate alternative systems and to propose the most feasible and desirable systems for developments.
The primary areas of interest are:
- Technical Feasibility
- Economic Feasibility, and
- Operational Feasibility.
2.3.1 TECHNICAL FEASIBILITY:
Technical feasibility centers on the existing computer system (hardware, software etc.) and what extent it can support the proposed system. There would be no cost involved here because all the hardware and software that are specified and which are needed in the project are present before hand, and hence this software is technically feasible.
2.3.2 ECONOMIC FEASIBILITY:
Cost/benefit analysis or Economic feasibility is the most important method used for evaluating the effectiveness of a candidate system. The procedure is to determine the cost and benefits/savings that are expected from a candidate system and compare with the costs. If cost is less and benefit is high, then the decision is made to design and implement the system. Otherwise further justification or alteration in the proposed system will have to be made if it is to have a chance of being approved.
All the required facilities i.e., hardware to be used which includes and software to be used which are present before hand. Also, there would be no cost of training either because the company has their own training division, where in they give the training to the programmers. Regarding the maintenance, since the source code will be with the company, any small and necessary changes can be done with no cost involved in it.
2.3.3 OPERATIONAL FEASIBILITY:
Proposed solution is beneficial only if they can be turned into information systems that will meet the organization’s operating requirements. This test of feasibility asks if the system will work when it is developed and installed.
3.SYSTEM SPECIFICATION
3.1 Hardware Specification
Development hardware
Processor : Intel Pentium IV Processor
Memory size : 128 MB RAM
Storage : 20 GB Hard Disk
1.44 MB - 3.5” Floppy Disk
Display : EGA/VGA Color Monitor
600 x 800 Pixels Resolution
High Color (16 Bit)
Key Board
Mouse
UPS
Serial Cable
COM Port
Micro Controller
3.2Software Environment
Development software
Operating System : WINDOWS 2000 SERVER
Development tools : VISUAL BASIC 6.0
4.System Design
4.1 DESIGN AND DEVELOMENT PROCESS:
Design is a creative process; a good design is the key to effective system. The term “Design” is defined as “The process of applying various techniques and principles for the purpose of defining a process or a system in sufficient detail to permit its physical realization”. Various design features are followed to develop the system. The design specification describes the features of the system, the components or elements of the system and their appearance to end-users.
In system design high-end decisions are taken regarding the basic system architecture, platforms and tools to be used. The system design transforms a logical representation of what a given system is required to be in to the physical specification. Design starts with the system’s requirement specification and coverts it into a physical reality during the development. Important design factors such as reliability, response time, throughput of the system, maintainability, expandability, etc should be taken into account.
4.1.1 Fundamental Design Concepts:
A set of fundamental design concepts has evolved over the past decades. Although the degree of interest in each concept has varied over the years, each has stood the test of time. Each provides the software designer with a foundation from which more sophisticated design methods can be applied. The fundamental design concepts provide the necessary framework for "getting it right".
The fundamental design concepts such as abstraction, refinement, modularity, software architecture, control hierarchy, structural partitioning, data structure, software procedure and information hiding are applied in this project to getting it right as per the specification.
Software Design is an iterative process through which requirements are translated into a “blueprint” for constructing the software. Initially, the blueprint depicts a holistic view of software. That is, the design is represented at a high level of abstraction- a level that can be directly traced to the specific system objective and more detailed data, functional, and behavioral requirements. As design iterations occurs, subsequent refinement leads to design representation at much lower level of abstraction. These can be still traced to requirements, but the connection is subtler.
The design implements all of the explicit requirements contained in the analysis model, and also accommodate all of the implicit requirements desired by the costumer. It is a readable, understandable guide for those who generate code and for those who test and subsequently support the software. It provides a complete picture of the software, addressing the data, functional, and behavioral domains from an implementation perspective.
Software Design is both a process and a model. The design process is a sequence of steps that enables the designer to describe all aspects of the software to be built. The design model begins by representing the totality of the thing to provide guidance for constructing each detail. The design model created for software provides a variety of different views of the computer software. Basic design principles enable the software engineer to navigate the design process, to create a design model that exhibits both external and internal quality factors. External quality factors are those properties of the software that can be readily observed by the users. The external quality factors lead to a high-quality design from a technical perspective.
4.1.2 USER INTERFACE DESIGN:
The overall process for designing a user interface begins with the creation of different models of system function. The human- and computer- oriented tasks that are required to achieve system function are then delineated; and design issues that apply to all interface designs are considered; tools are used to prototype and ultimately implement the design model; and the result is evaluated for quality. The goal of interface design is to define a set of interface objects and actions (and their screen representations) that enables a user to perform all defined tasks in a manner that meets every usability goal defined for the system.
An important step in interface design is the definition of the interface objects and the actions that are applied to them. Once they have been defined and elaborated iteratively, they are categorized by type. Target, source and application objects are identified. When the designer is satisfied that all important objects and actions have been defined, screen layout is performed.
Screen layout is an interactive process in which graphical design and placement of icons, definition of descriptive screen txt, specification and titling for windows, and definition of major and minor menu items is conducted. If a real world metaphor is appropriate for the application, it is specified at this time and the layout is organized in a manner that complements the metaphor.
4.1.3 Cost Estimation:
Software cost is related to many variables - Human, Technical, Environment, Political and Effort applied to develop it. However, software project estimation can be transformed from a blank art to a series of systematic steps that provide estimates with acceptable risks.
The estimates of cost depend, in turn, on our ability to estimate and evaluate several factors, given below
- Experience and ability of the project personal.
- The quality of software development environment
- The degree to which our understanding of the problem and its acceptable solutions is likely to change.
- The complexity of the eventual code.
- The length of the eventual code.
- The degree to which software components can be reused.
- The degree of market readiness for the product.
- The amount of evaluation the product will eventually undergo.
4.1.4 Data Flow Diagram:
The graphical description of the system’s data and how the process transforms the data is known as Data Flow Diagram.
A graphic picture of the logical steps and sequence involved in a procedure or a program is called a flow chart
Unlike detailed flowchart, Data Flow Diagrams do not supply detailed description of the modules but graphically describes a system’s data and how the data interact with the system.
To construct a Data Flow Diagram, we use,
- Arrow
- Circles
- Open End Box
- Squares
An arrow identifies the data flow in motion. It is a pipeline through which information is flown like the rectangle in the flowchart. A circle stands for process that converts data into information. An open-ended box represents a data store, data at rest or a temporary repository of data. A square defines a source or destination of system data.
Rules for constructing a Data Flow Diagram
- Arrows should not cross each other.
- Squares, circles and files must bear names.
- Decomposed data flow squares and circles can have same names.
- Choose meaningful names for data flow
- Draw all data flows around the outside of the diagram.
Control information such as record count, passwords and validation requirement are not pertinent to Data Flow Diagram.
|